If you zoned out in class and now find yourself scrambling for tutorials online—fear not! There’s likely an Indian tutor on YouTube ready to guide you through that tricky math problem, complex programming concept, or mind-bending quantum physics puzzle. But why is it always an Indian tutor? Are they especially skilled in STEM content? How did this trend start, and what unique factors set them apart? In this project, we’ll uncover the story behind the rise of Indian STEM educators on YouTube.

Behind the Numbers: Our YouTube Data Deep Dive
The rise of Indian STEM educators is no accident—it’s a phenomenon supported by compelling data and unique trends. To understand what sets them apart, we analyzed a vast treasure trove of information using YouNiverse, a comprehensive dataset of YouTube channel and video metadata in English.
Spanning over 136,000 channels and 72.9 million videos, YouNiverse enabled us to trace the growth of Indian STEM content, study patterns in video uploads and engagement, and even understand audience sentiment. Armed with these insights, let’s embark on a journey through the numbers to uncover the story they tell about India’s educational YouTube revolution.
India’s Educational YouTube Revolution
First, let’s set the stage by looking at the big educational picture on YouTube. Just how dedicated are different countries to producing educational content?
The graph below compares the top 10 countries with the most videos, contrasting their channel contributions to educational content versus other categories:
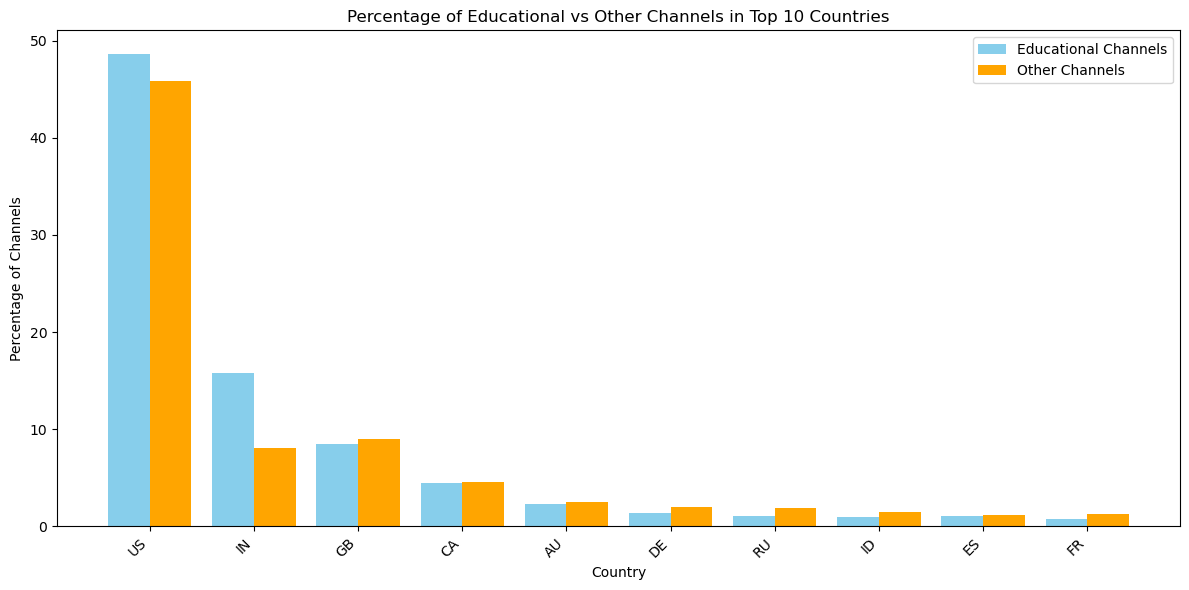
Most countries display only modest differences between educational and non-educational content creation. Yet, India’s focus on education is not merely incidental—it’s a deliberate and defining characteristic. To understand why STEM emerged as a dominant force within this ecosystem, we need to zoom in further.
Next, let’s consider each country’s own “mix”: the share of educational content relative to its entire video output. Once again, India emerges as a clear outlier, producing a notably larger slice of educational content compared to its total volume. In other words, Indian creators are notably devoted to educational material.

To understand the STEM role as a dominant force within this ecosystem, we need to zoom in further.
The STEM Phenomenon: Indian Tutors Take the Lead
STEM fields—Science, Technology, Engineering, Mathematics—are notoriously tough. From personal experience as engineering students, we know how stressful these topics can be. Yet, whenever we search YouTube for help, an Indian tutor is often there, calmly explaining the concept.
But how did this niche become so heavily associated with Indian creators? Let’s take a look behind the scenes.
Under the Hood: Our STEM Content Detection Strategy
To identify STEM videos among the sea of educational content, we tapped into the rich course archive of MIT OpenCourseWare (OCW). We defined 152 STEM-related topics from their existing topic —ranging from theoretical physics to computer science—and extracted clean, usable keywords (like “Linear Algebra” or “Quantum Mechanics”) as our detection blueprint.
When working with a whopping 1.9 million educational videos, efficiently detecting STEM-related content becomes a serious challenge. We start by focusing on their titles and tags—two key sources of descriptive metadata—and we rely on a two-step approach: first, fast exact keyword matching, and then, if needed, fuzzy matching to catch near misses.
Step 1: Lightning-Fast Keyword Matching with FlashText
Our first line of defense is the FlashText processor. Think of it as a high-speed filter that scans through video titles and tags in search of direct hits from our curated list of STEM keywords. These keywords can be single words like “physics” or phrases like “differential equation.” If FlashText finds an exact match, great! The video has passed the first test for being STEM-related. If not, it’s time for backup.
Step 2: Second-Chance Fuzzy Matching for Multi-Word Phrases
Sometimes a keyword doesn’t show up exactly as is. Maybe there’s a slight typo—”pyhton” instead of “python”—or a small variation in phrasing. In those cases, we turn to fuzzy matching. For multi-word keywords, we generate short sequences (n-grams) of up to four words from the title or tags. Each n-gram is then compared against our known STEM phrases with a fuzzy matching threshold of 90%. This ensures that “Phyton” would still match “Python,” for example, while ruling out something too different like “Phytoplankton.”
-
Parallel Processing for Speed
Scanning millions of titles and tags is no walk in the park. To keep things efficient, we run these checks in parallel using Python’s ThreadPoolExecutor. Imagine an assembly line of robots simultaneously testing titles and tags. This parallelism helps us tackle the massive dataset without waiting forever.
-
Tag Matching and Thresholds
Titles are one thing—short, sweet, and often right to the point. For titles, finding just one solid STEM keyword match is usually enough to call it STEM-related. Tags, on the other hand, can be numerous and varied. Here, we raise the bar: of all the tags on a video, at least half must be recognized as STEM-related to seal the deal. This 50% threshold ensures that a few stray STEM tags mixed in with non-STEM terms won’t misclassify the video.
-
The Intersection Rule
It’s not enough for a video just to have a STEM-rich title. We also want to see that its tags back up that claim. That’s why we only classify a video as STEM if it passes both tests:
- Its title must contain a recognized STEM keyword.
- At least half of its tags must be STEM keywords.
This intersection rule prevents false positives—like a travel vlog from Java (the island) being mistaken for a programming tutorial—and reduces false negatives by requiring consistency across both metadata sources.
From a total of 1.9 million educational videos, our pipeline successfully filtered approximately 74,717 STEM videos. To gain an initial understanding of the themes and topics within these filtered videos, we generated a word cloud based on the titles of all detected STEM videos to observe the key terms and subjects dominating STEM content on YouTube:
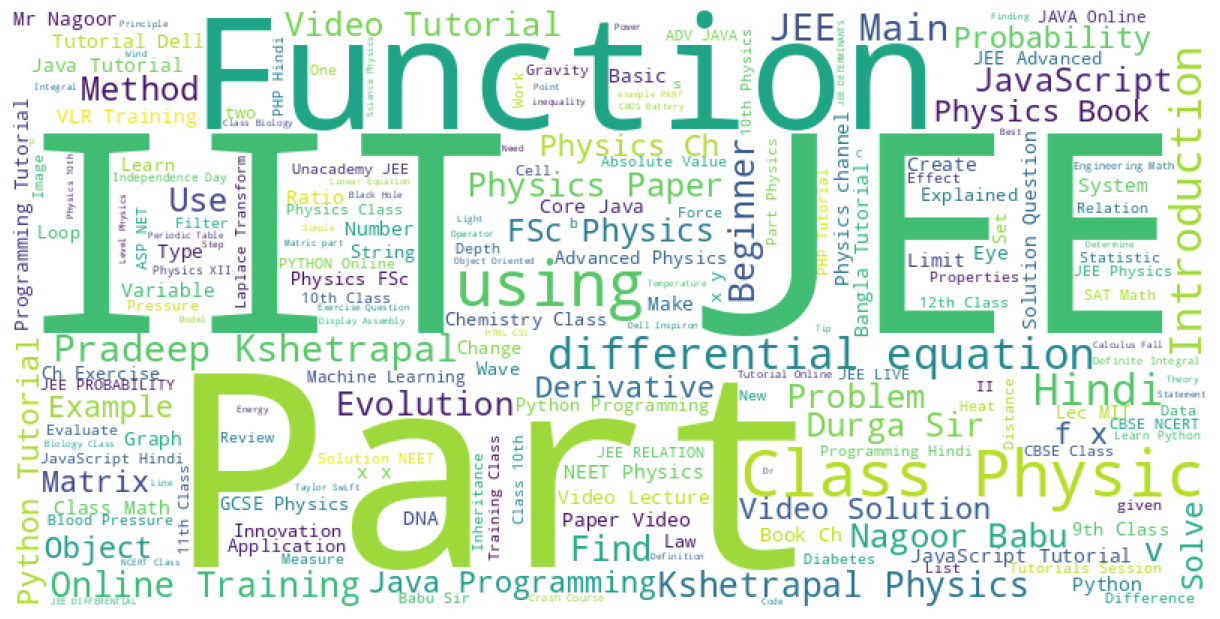
The word cloud highlights a strong focus on educational content in physics, mathematics, and programming, with prominent keywords such as ‘Function,’ ‘Differential Equation,’ ‘Physics,’ and ‘Tutorial’ dominating the visualization. Foundational learning is a recurring theme, evident in terms like ‘Beginner,’ ‘Introduction,’ and ‘Example,’ alongside exam-oriented content such as ‘JEE,’ ‘NEET,’ and ‘CBSE.’ The presence of terms like ‘Python,’ ‘JavaScript,’ and ‘Matrix’ underscores the growing demand for programming tutorials within the STEM domain.
Interestingly, the inclusion of ‘Hindi’ provides an early indication of how a significant portion of these videos are tailored to Indians. Well-known educators like Pradeep Kshetrapal and Durga Sir stand out, illustrating the influence of individual creators in shaping this space.
Do Indian Creators Really Dominate STEM?
To confirm the suspicion that Indian creators are true STEM powerhouses, we compared the proportion of STEM videos to total educational videos for the top 10 countries:
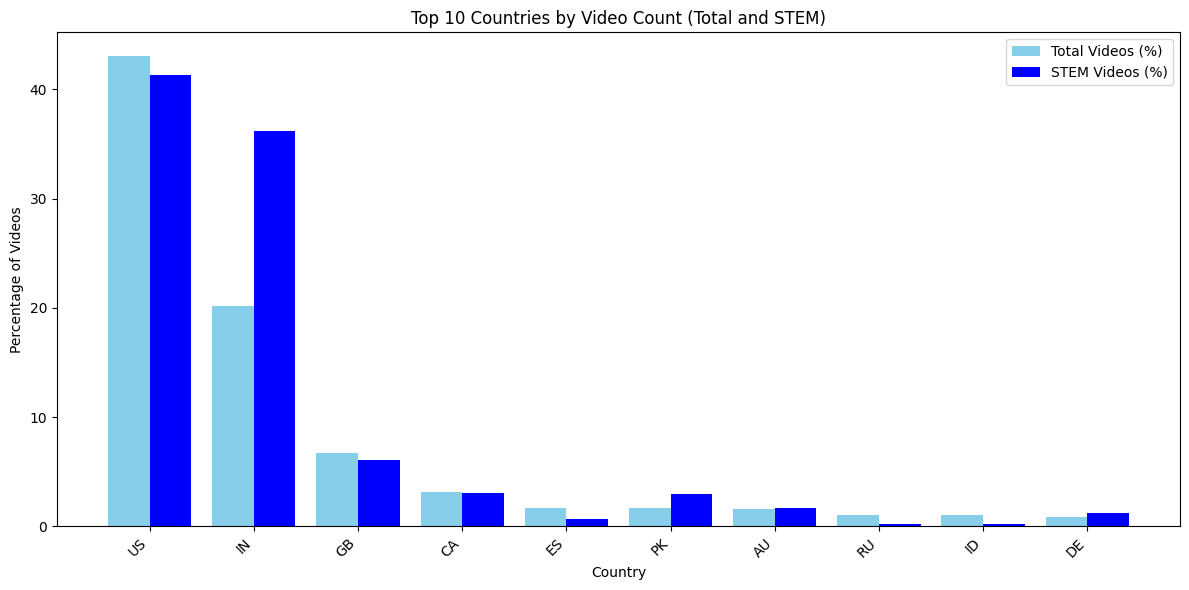
The figure clearly highlights the dedication of Indian creators to producing STEM content. While creators from other countries maintain a relatively consistent share of contributions across other content categories, Indian creators stand out by dedicating a significantly larger proportion of their efforts to STEM videos.
Even though the US accounts for a large share of both total videos and STEM content, the gap between the total number of videos and the proportion of STEM videos is much more pronounced in India. While the proportion of STEM videos from the U.S. is only slightly higher than India, Indian creators significantly outpace the rest of the world in their focus on STEM content.
When did this happen?

Looking at the evolution from 2005 to 2019, the U.S. dominated early on, but around 2011, India’s STEM creation skyrocketed. By 2016, India outpaced the U.S. in the number of STEM videos, and while the U.S. still leads in total views and likes, India’s metrics are catching up fast. This suggests that Indian creators aren’t just releasing content—they’re steadily building global engagement.
It seems Indian creators are focusing heavily on volume. While total views and likes are still catching up, they are getting remarkably close to U.S. figures. This indicates a growing global engagement with Indian STEM content, suggesting that Indian creators are not only producing more videos but are also steadily gaining traction in terms of audience reception and influence.
Is this growth generally stable? To explore this, we examine the relative growth rates of STEM video creation through the same line graphs, but this time focusing on growth rate instead of absolute numbers:

The data reveals that, at certain points in time, other countries also experienced surges in STEM content creation. However, these spikes were typically short-lived, with production rates seemed to decline after the peak and eventually stabilizing at relatively lower levels. In contrast, India experienced a smaller surge around 2011, but unlike others, its growth rate remained steady and consistent over time. This sustained upward trajectory eventually positioned India as the key player in STEM video creation, as previously observed.
Decoding the Influence: Content and Strategy of Indian Channels
India’s sustained growth in STEM video creation is an extraordinary trend, but growth alone doesn’t tell the whole story. To understand why Indian creators have risen to prominence, we must look deeper into the characteristics of these channels.
From Physics to Programming: What Indians Teach Best
From the STEM keywords we collected earlier, we derived a high-level hierarchy of categories (e.g., ‘linear algebra’ under ‘mathematics,’ ‘quantum mechanics’ under ‘physics,’ etc.). We then mapped these categories to the videos to create a topic breakdown of Indian STEM content. We depict the top 10 topics covered in Indian STEM videos:

Among these defined categories, “programming languages” dominates the most popularity among viewers, followed by physics and biology. The remaining categories — science, artificial intelligence, physical chemistry, thermodynamics, signal processing, and chemistry graphics and visualization — each contribute a smaller yet significant portion to the overall distribution, reflecting a broad interest in various STEM fields within India’s YouTube audience.
Let’s also examine how these topics have evolved over time and compare them across different countries:
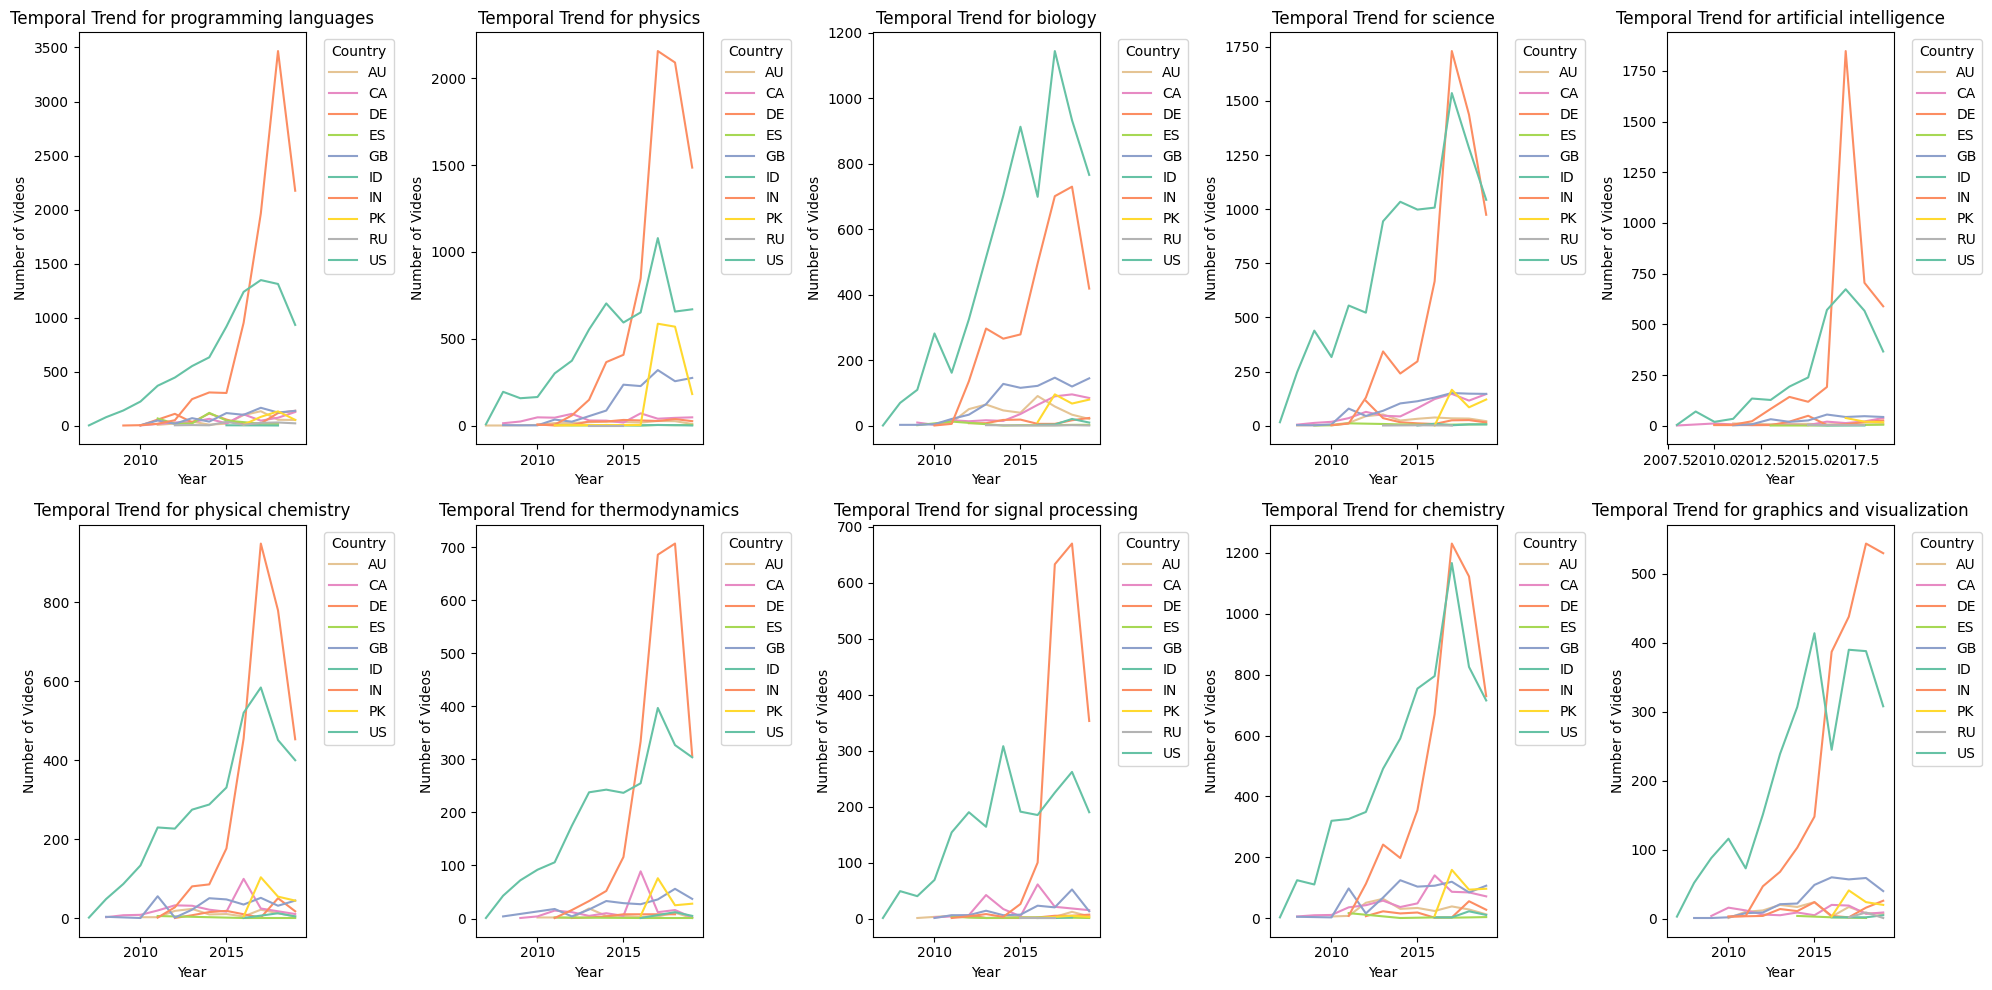 From the graph, it is clear once again that India and the U.S. are the two dominant players in the top STEM categories. While the U.S. began much earlier than India, we can observe that India experienced a much faster surge, occasionally surpassing the U.S. in certain periods.
Money Matters: Are They Teaching for Profit?
Indian creators produce a lot of STEM videos. One might wonder: Are they in it for the love of teaching, or is monetization fueling the fire?
To investigate this, we drew upon a framework from a prior work, which defines three main monetization strategies for conventional YouTube videos:
merch_channels(channel-owned merchandise)merch_others(affiliate marketing)donation(financial support)
We then analyzed the prevalence of these strategies among Indian creators and compared them with other leading STEM video-producing countries, as shown below:
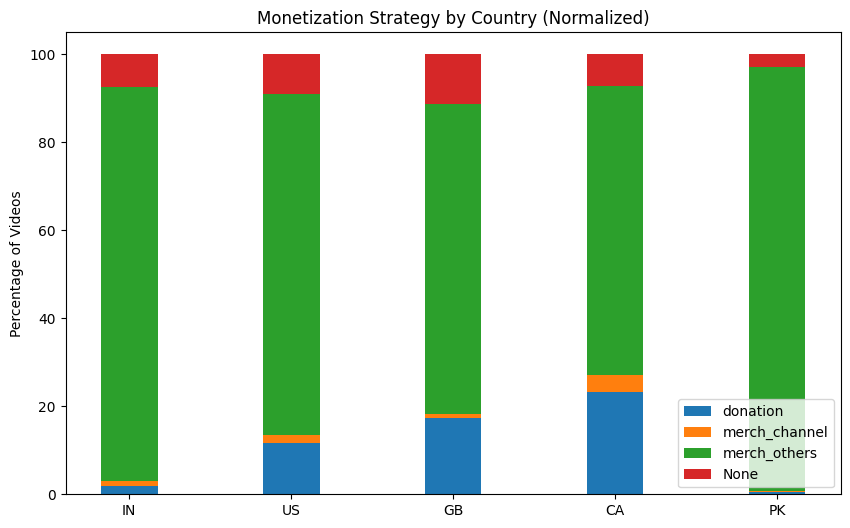
From this, it’s clear that each country employs different monetization strategies for their STEM content. However, the specific impact of each strategy on video creation remains unclear. Let’s now take a closer look at India to better understand this dynamic:
As observed, Indian creators predominantly adopt the merch_others monetization strategy. Let’s examine some examples to better understand how this strategy is implemented:
| Video Description |
|---|
| Launch Your First Android app with our TOP course at 82% OFF (24 hrs ONLY) HERE https://goo.gl/7veBXc” Learn How To Design + Code A Complete App From Scratch To Playstore” https://www.youtube.com/watch?v=aWGGZCOHZ1k |
| This video shows how to build a RelativeLayout in Java code using RelativeLayout.LayoutParams class and creating other. Check us out at http://facebook.com/Slidenerd |
| Doubtnut के साथ १००% मार्क्स पायें, आज ही डाउनलोड करें :- https://doubtnut.app.link/91GzfmKxjP Related Questions & Solutions: 1. Evaluate the definite integrals int-1 1(x+1)dx… https://youtu.be/rvm3ufXmQyI2. Evaluate the definite integrals int_2^3 1/x dx…https://youtu.be/qI7zCysjDB83. Evaluate the definite integrals int_1^2(4x^3-5x^2+6x+9)dx…https://youtu.be/VOiZh18X8BM |
We can see that these creators often provide links to courses, apps, and other services, encouraging viewers to make purchases using their referral codes or links. What stands out across these samples is the heavy reliance on offering supplementary learning tools or services, reinforcing the notion that Indian content creators are tapping into the growing demand for educational resources by blending their content with monetized services.
To analyze whether monetization strategies influence the number of videos produced by Indian channels, we conducted a regression analysis. Specifically, we explored how each of the dummy monetization categories—merch_channels (channel-owned merchandise), merch_others (affiliate marketing), and donation (financial support)—correlates with the number of videos produced by the channel. The regression result is shown as follows:

The results of the regression analysis indicate a noteworthy trend: channels utilizing merchandise as part of their monetization strategy (merch_channels) tend to produce significantly more videos than those relying on donations or affiliate marketing. This suggests that having an in-house merchandise strategy may provide more stable, long-term revenue streams, which could incentivize creators to consistently produce more content to boost their sales.

On the other hand, channels that rely on donations or affiliate marketing appear to have less frequent content production, possibly due to the more variable nature of these revenue streams. While affiliate marketing can be lucrative, it may require additional promotional efforts that are not always tied to video production.
However, while each of the categorical variables (merch_channels, merch_others, and donation) is statistically significant, this does not imply practical significance, especially given the low R-squared value of 0.035. This means that only 3.5% of the variance in the number of videos produced can be explained by these monetization categories. Therefore, while monetization strategies seem to have some effect, they are likely not the only factors driving video production. Other variables, such as audience engagement, channel size, or content trends, may play a more significant role in shaping the video creation strategies of Indian YouTubers. We will investigate these potential factors further in the next section.
Success Strategies: How Indian Channels Grow
From above, we can see monetization may not be the main drive for Indians, then what specifically is their content creation strategy? Let’s first go back to check their quantity.
More Videos, More Success? The Upload Strategy?
We observed that some Indian STEM content creators adopt a quantity-driven strategy to run their channels. For example, Ekeeda, an Indian academy that covers almost every field in STEM, produces more than 100 videos per week. This raised our curiosity about whether this strategy helps their channels grow.
To explore this, we performed a T-test to examine whether Indian channels tend to produce more videos compared to channels from other countries. The results revealed that, on average, Indian channels produced 5.5 videos per week, significantly higher than the 2.0 videos per week produced by channels in other countries (t-statistic: 5.5, p-value: 0.0). This finding suggests that Indian channels consistently produced more videos from 2015 to 2019.

In some channels like Ekeeda, as mentioned, there are instances where a spike in uploads is followed by a rise in subscriber growth(e.g., around mid-2017 and mid-2018), this is not always consistent. In some weeks, high upload counts do not correspond to significant subscriber gains, suggesting that quantity alone may not guarantee growth.
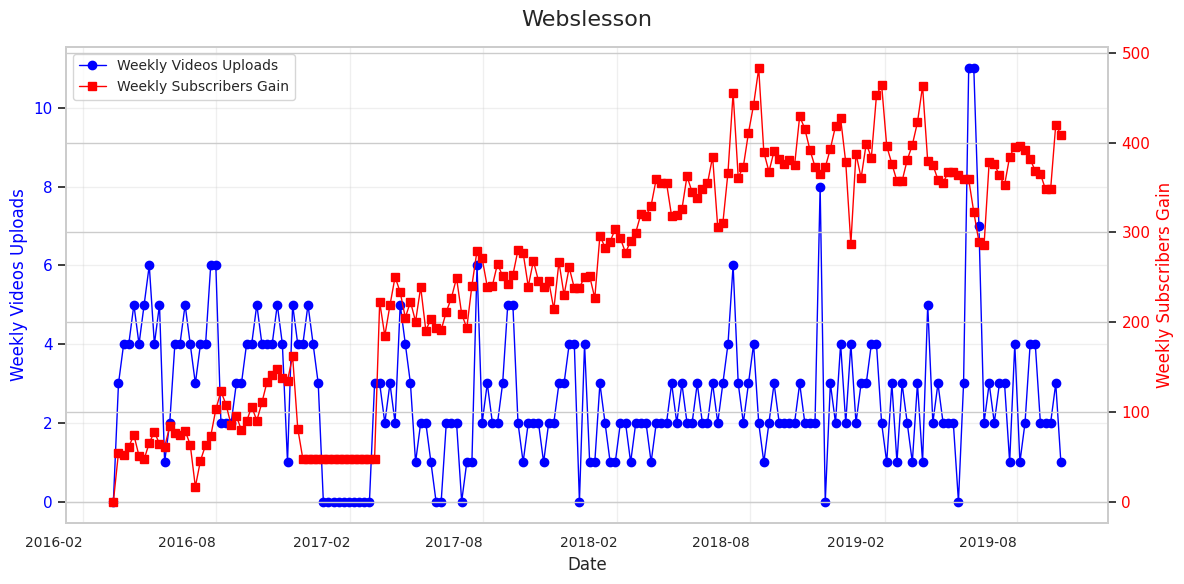
In contrast, channels like Webslesson demonstrate a clear alignment between upload frequency and subscriber growth. Despite having a relatively small number of weekly uploads, the consistent upload schedule appears to contribute significantly to steady subscriber growth.
To further investigate the relationship between uploads and growth metrics, we analyzed the correlations across channels.

While the correlations are generally positive, they remain relatively weak, with most values clustering below 0.2. This suggests that while regular uploads may contribute to growth, their effect is limited.
Overall, while Indian channels often rely on a quantity-driven strategy, the data shows that this approach alone does not guarantee success.
Exam Season Heroes: When Students Need Them Most
Interestingly, beyond upload strategies, certain periods of the year appear to have an outsized impact on channel performance. Exam seasons, for instance, often see a surge in students seeking educational content on YouTube, giving rise to the popular meme, “There is always an Indian guy teaching you STEM content.”
To investigate whether Indian STEM channels experience higher views during exam periods, we conducted a t-test analysis for each channel, focusing on views during exam months (typically May and June for the spring semester, and November and December for the autumn semester).
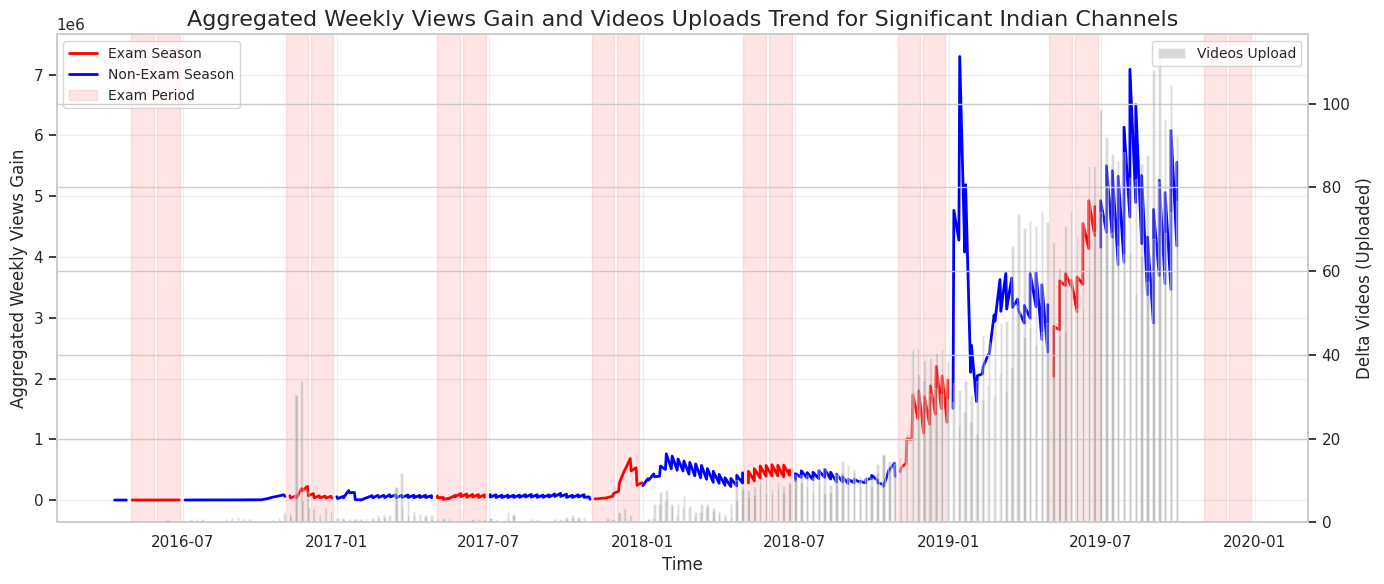
Our analysis reveals that some channels exhibit significantly higher views during these periods. It indicates a strong alignment between exam preparation needs and the educational content provided by these channels. The aggregated weekly views gains show noticeable grows during exam seasons, underscoring the role these channels play in meeting student demands.
This growths during exams reflects a strategic opportunity for content creators to tailor their uploads to the academic calendar, optimizing their engagement and reach during high-demand periods. But the right strategy is not the only key — quality of content also matters.
Quality Check: How Well Do Indian Tutors Teach?
By the Numbers: How Indian Tutors Compare Globally
First, let us compare how users engage with STEM content produced in fifferent locations. We compared average number of views, mean number of likes and comments per 100 views for top-10 most STEM-fruitful countries:
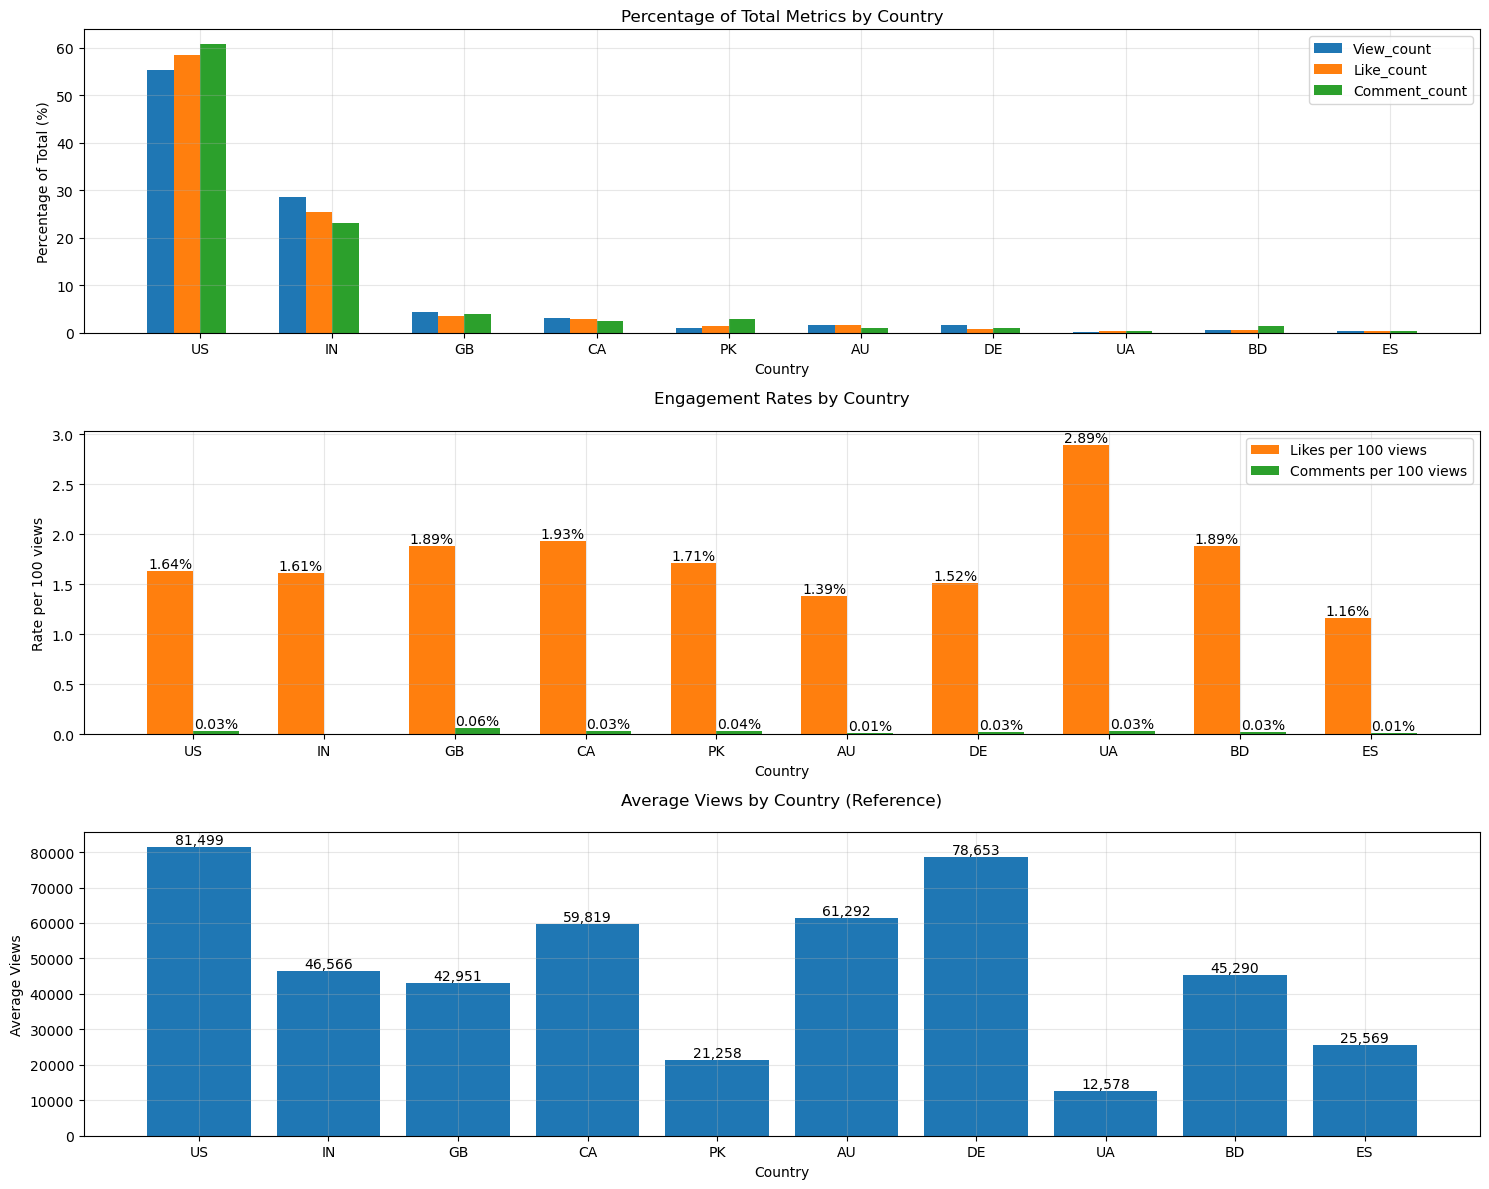
Although Indian video makers took the 2nd place in the amount of content produced, their average engagement metrics are average or below average:
- 4th place in average views per video (46,5k);
- 6th place in average likes per view (only 1.61%);
- average comments per 100 views is very close to zero, which makes Indian content the less commented in our chart.
We noticed that the least viewed content producers got higher engagement rates, e.g. Ukrainian videos got 2.89% likes per view with only 12,5k average views number. Hence, we explored the distribution of likes and comments for Indian and Ukrainian videos relatively to the views number:
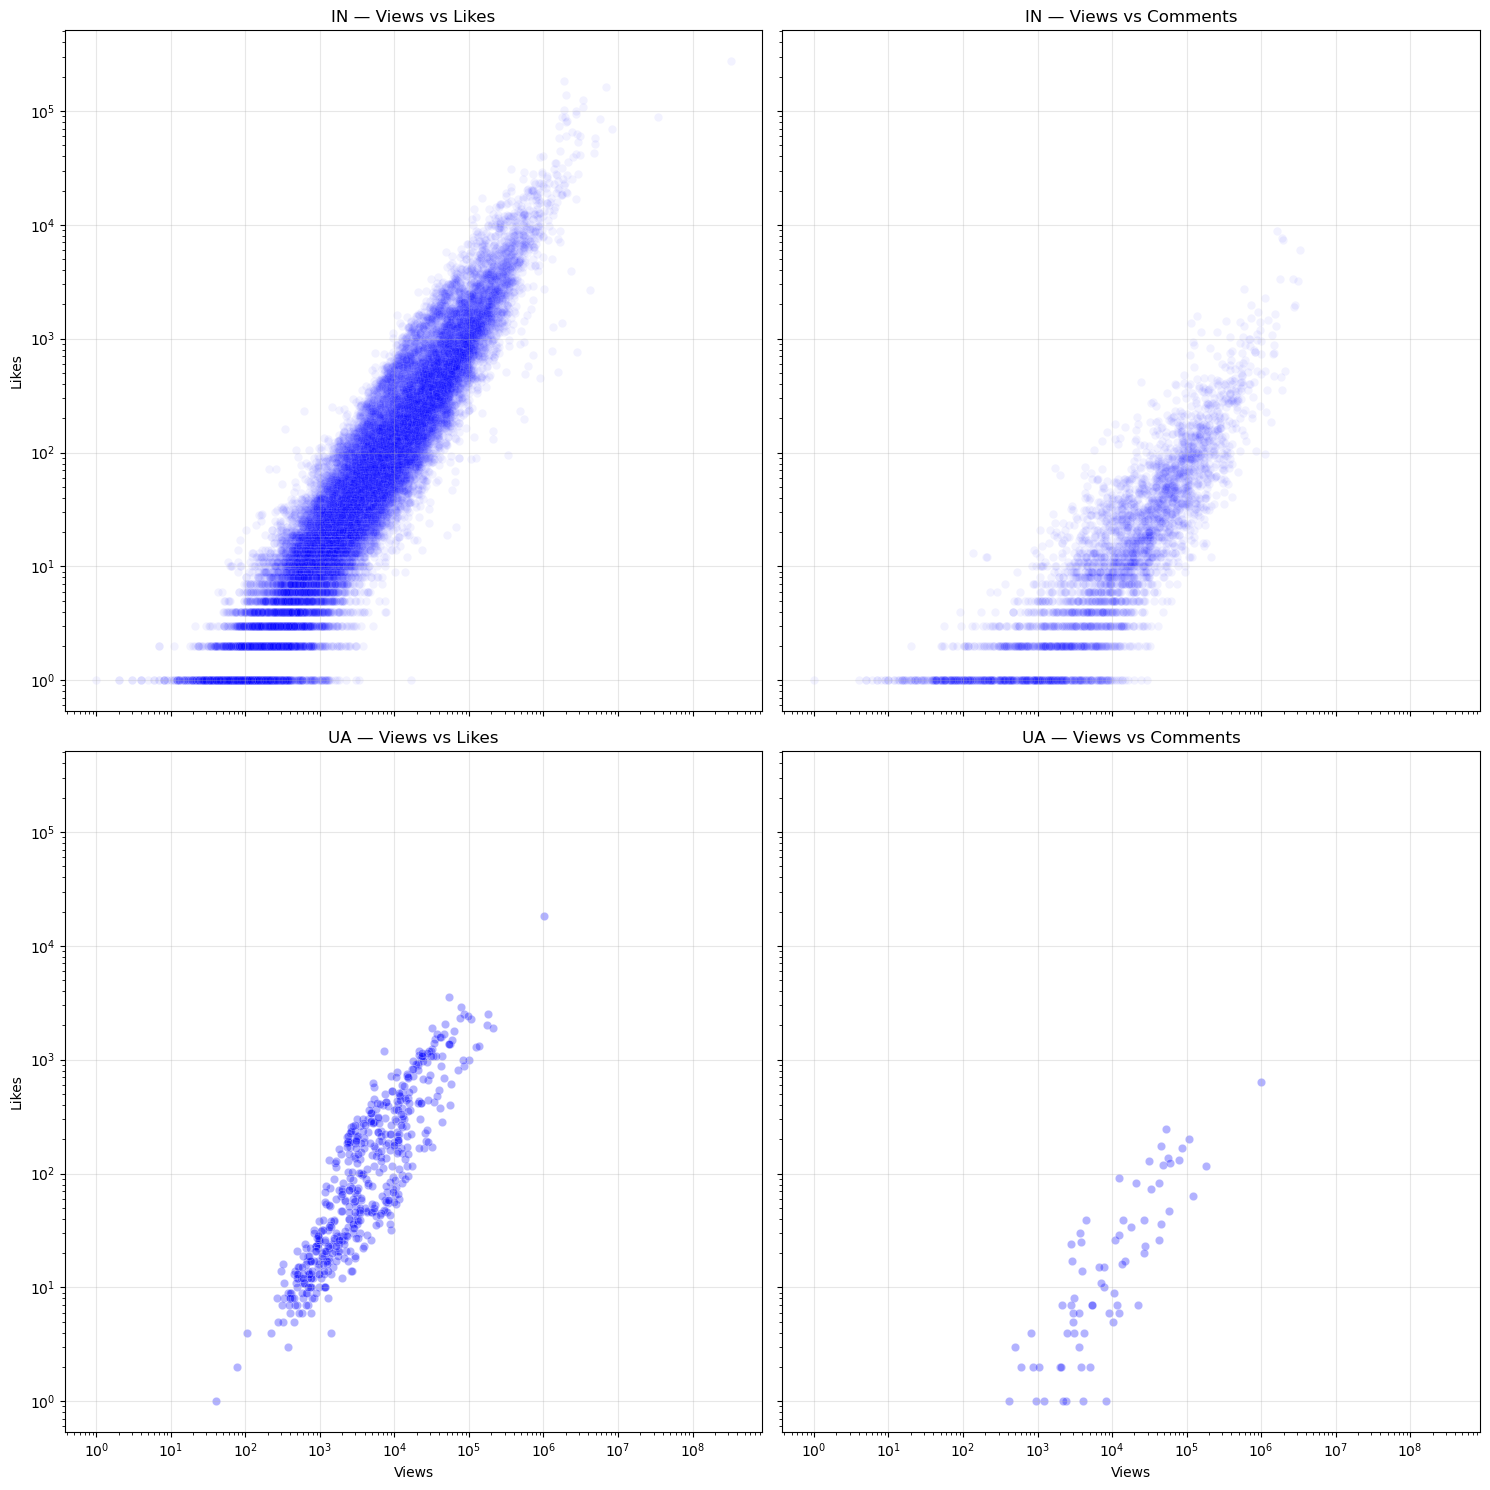
As we can see here, STEM videos created by Indians are distributes closer to lower likes and views metrics. However, the most popular Indian videos have higher engagement metrics than the most popular Ukrainian videos. Therefore, we should consider that Indian content-makers bring more content (50 times more than UA), so the low rates of the most unpopular videos influence average metrics. Let’s have a closer look at the most popular STEM videos:
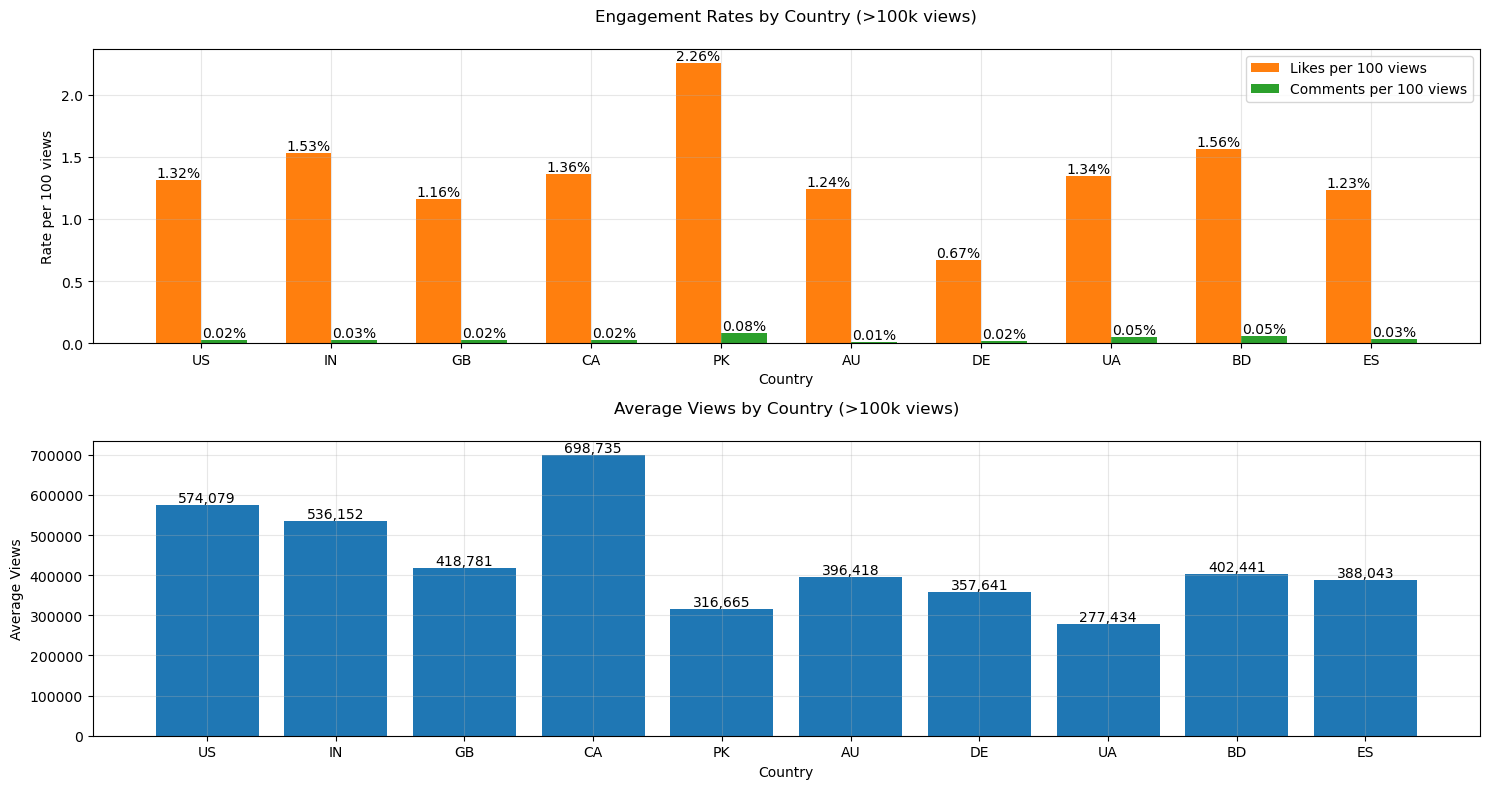
After comparing the rates of the videos with more than 100k views, we see that on average Indian videos engage better:
- 3rd place in likes per 100 views — right after Pakistan and Bangladesh. These countries have are represented in this data by 70 and 39 videos respectively, while India is respresented by 1781 videos. Lower number of videos can provide more outliers impacting the means, so it’s more important that Idian’s engagement rate is higher than American’s and Great Britain’s, the countries with closer numbers of highly viewed STEM videos (3517 and 316).
- 3rd place in average views — right after Canada and the USA.
- 4th place in comments per views.
The comment rates are the most difficult to interpret, so this data requires additional analysis.
The Verdict: What Students Really Think
Since YouTube API stopped sharing number of dislikes in 2021, we cannot refresh this information as we did for the comments and likes to evaluate the engagement. Therefore, to analyze the quality of content produced by Indian STEM educators, we should investigate the comments.
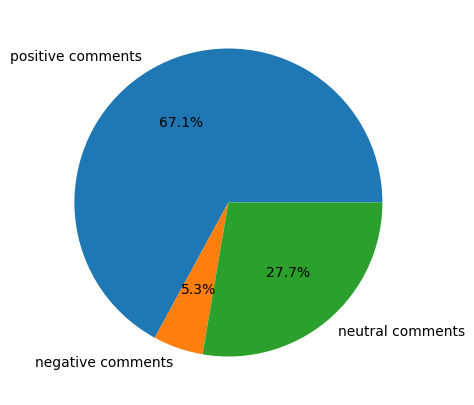
For the sentiment analysis, we picked a 3% sample and crawled comments for each video. After filtering out the videos with no comments, we had 1651 videos with 141 003 comments to analyse. To classify the positive, negative and neutral comments, we used VADER Sentiment Analysis:
- Compound score > 0.03 for positive sentiment;
- Compound score < -0.15 for negative sentiment;
- Compound score between 0.03 and -0.15 for neutral sentiment.
Such thresholds were adjusted based to the sampled comments. In complex cases, comments were missclassified because of sarcastic tone, controversial parts (the video is good, but…) but in general, we found these thresholds most efficient.
Classified comments samples:
| Positive | Negative | Neutral |
|---|---|---|
| Thank you guru jiii | For some reason the JS code doesnt change the active class for me. Do you know why? | Ma’am, I think You didn’t mention the use of mixer blender in the experiment |
| this vedio is very nice and are all parts are to the point . | Mam… there is an mistake in Question number 6th the derivative of cos is -sin and the answer is -a/2b | more image,more meme |
| these videos are Awesome but not in a sequencial manner we are getting confused…please make proper playlist of topis with complete topocs. thankyou | Instead of using only ddNTP we also use the same nucleotide otherwise a reaction for ddGTP will stop at 2nd step only and it will not move further to 3rd or 7th step without a free OH group. | The summary of the video is, that the difference between deterministic finite automaton and the non deterministic finite automaton. So in deterministic automaton, there is a unique next state which has no choice of randomness and is simple and easy to design. They are multiple next states which can be achieved using or consuming one input or no input in that case, in that case it is called that input epsilon. So that’s a brief overview and differentiation between deterministic finite automaton and non deterministic finite automaton. |
| Jo bhi dislikers Ho Kahi BhI Dhundhlo tumhe isse best lecture Kahi nahi milega | STOP HAVING THESE PEOPLE WITH HEAVY ACCENTS NARRATE YOUR VIDEOS!!!!!!!!!!!!!!!!!!!!!!!!!!!!!!!!!!!!!!!! | NIC VIDEO |
| Simply best…. | Worst audio with unclear explanation. I’m talking about whole playlist, this is genuine critisism | E=MC2. E=energy. M=represent unit of mass. C =speed of light in vacuum 💪💪🇮🇳🇮🇳🇮🇳🇮🇳🇮🇳 |
The majority of comments are positive. The negative comments often contain complains on the audio quality or mistakes. Since most popular Indian STEM content has only 0.03 comments per 100 views, the number of negative comments is only 0.0081 per 100 views. Comparing such a low rate with the high amount of likes and delighted comments, we can suppose that Indian engagement is like a self-fulfilling prophecy: the more engagement they bring, the more content they receive from Indian tutors.
Conclusion
The phenomenon of Indian STEM educators on YouTube represents a unique educational ecosystem driven by high content production, strategic timing around exam seasons, and generally positive student engagement. While these channels employ varying strategies—from high-volume uploads to exam-season targeting—their success appears rooted in meeting genuine educational needs rather than purely seeking monetization.
The data reveals that Indian STEM content, particularly videos with high viewership, achieves engagement rates competitive with or exceeding those of Western counterparts. Despite occasional criticism regarding audio quality or technical accuracy, the overwhelmingly positive sentiment in user comments suggests these educators effectively serve their educational purpose.
This research demonstrates that the prevalence of Indian STEM tutors on YouTube isn’t just a meme—it’s a measurable phenomenon backed by data, reflecting both the supply of dedicated educators and the global demand for accessible, quality STEM education.
References
-
Manoel Horta Ribeiro and Robert West. 2021. YouNiverse: Large-Scale Channel and Video Metadata from English-Speaking YouTube. In ICWSM. 1016–1024. https://arxiv.org/abs/2012.10378
-
Yiqing Hua, Manoel Horta Ribeiro, Thomas Ristenpart, Robert West, and Mor Naaman. 2022. Characterizing Alternative Monetization Strategies on YouTube. Proc. ACM Hum.-Comput. Interact. 6, CSCW2, Article 283 (November 2022), 30 pages. https://doi.org/10.1145/3555174